
ETM Dashboard
Capabilities
Simplified Management
Reduce management overhead by handling a range of tasks remotely with ETM Dashboard. It’s easy to make one-to-many policy changes across locations, then keep appliances in sync automatically. See appliance status at a glance, including uptime, bandwidth utilization, and network traffic summaries. Get valuable auditing logs about administrative changes, key to regulatory compliance. Manage licensing, software updates, backups and more.
Zero-Touch Provisioning
Easily configure NG Firewall and Micro Edge appliances remotely. Customers or partners with multiple locations and limited IT staff can simply set up the appliance to fit the needs of each location without the need for physical access.
Endpoint Security
ETM Dashboard’s integration with Bitdefender, Malwarebytes and Webroot provides administrators an easy way to see not only the status of remote NG Firewalls and Micro Edge devices, but also monitors connected endpoints on the network. Drill down into detailed information about hosts, get alerts when threats are detected, or even initiate an endpoint protection scan.
Networking
Centrally connect and manage all your locations by grouping NG Firewall and Micro Edge appliances together. Automatically connect appliances with auto-provisioning VPN, and view aggregated performance data for the entire network. Create shared WAN routing policies for Micro Edge appliances.
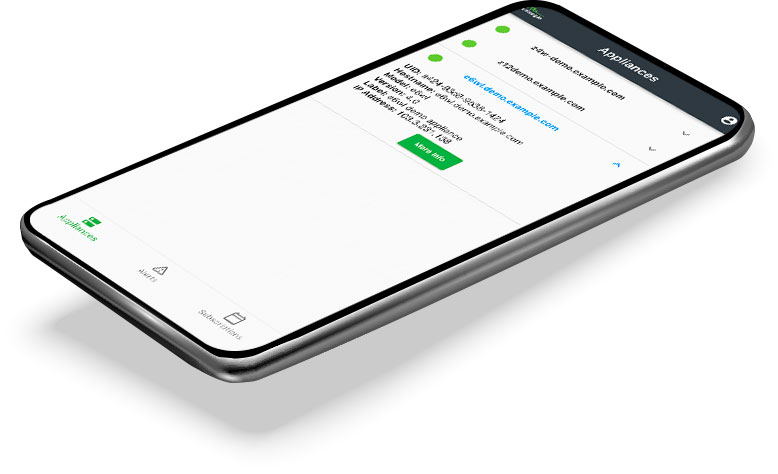
Mobile App
The ETM Dashboard mobile app gives IT administrators visibility of the appliances and subscriptions they manage with ETM Dashboard. The mobile app, for Android and iOS devices, enables you to view information about your appliances and subscriptions including status, alerts and system resources from your mobile device.
MSP Opportunity
ETM Dashboard is an ideal platform for managed services providers (MSPs), providing easy management of remote sites, no matter their location. Effectively manage firewalls, branch office routers and endpoint security from one console with a lightweight, cost-effective alternative to cumbersome and expensive RMMs. Contact us today to learn how ETM Dashboard can simplify security orchestration for MSPs.
To have access to the full functionality of ETM Dashboard, a paid subscription is required on each appliance.
ETM Dashboard Features
ETM Dashboard was designed to simplify the lives of administrators who need to manage multiple networks effectively and efficiently. As a cloud service, ETM Dashboard updates are seamless and automatic, providing immediate access to the latest improvements. By simplifying provisioning and licensing, organizations can realize immediate cost-savings from reduced management overhead. Real-time firewall, router and endpoint status alerts help with site management and maintaining regulatory compliance.
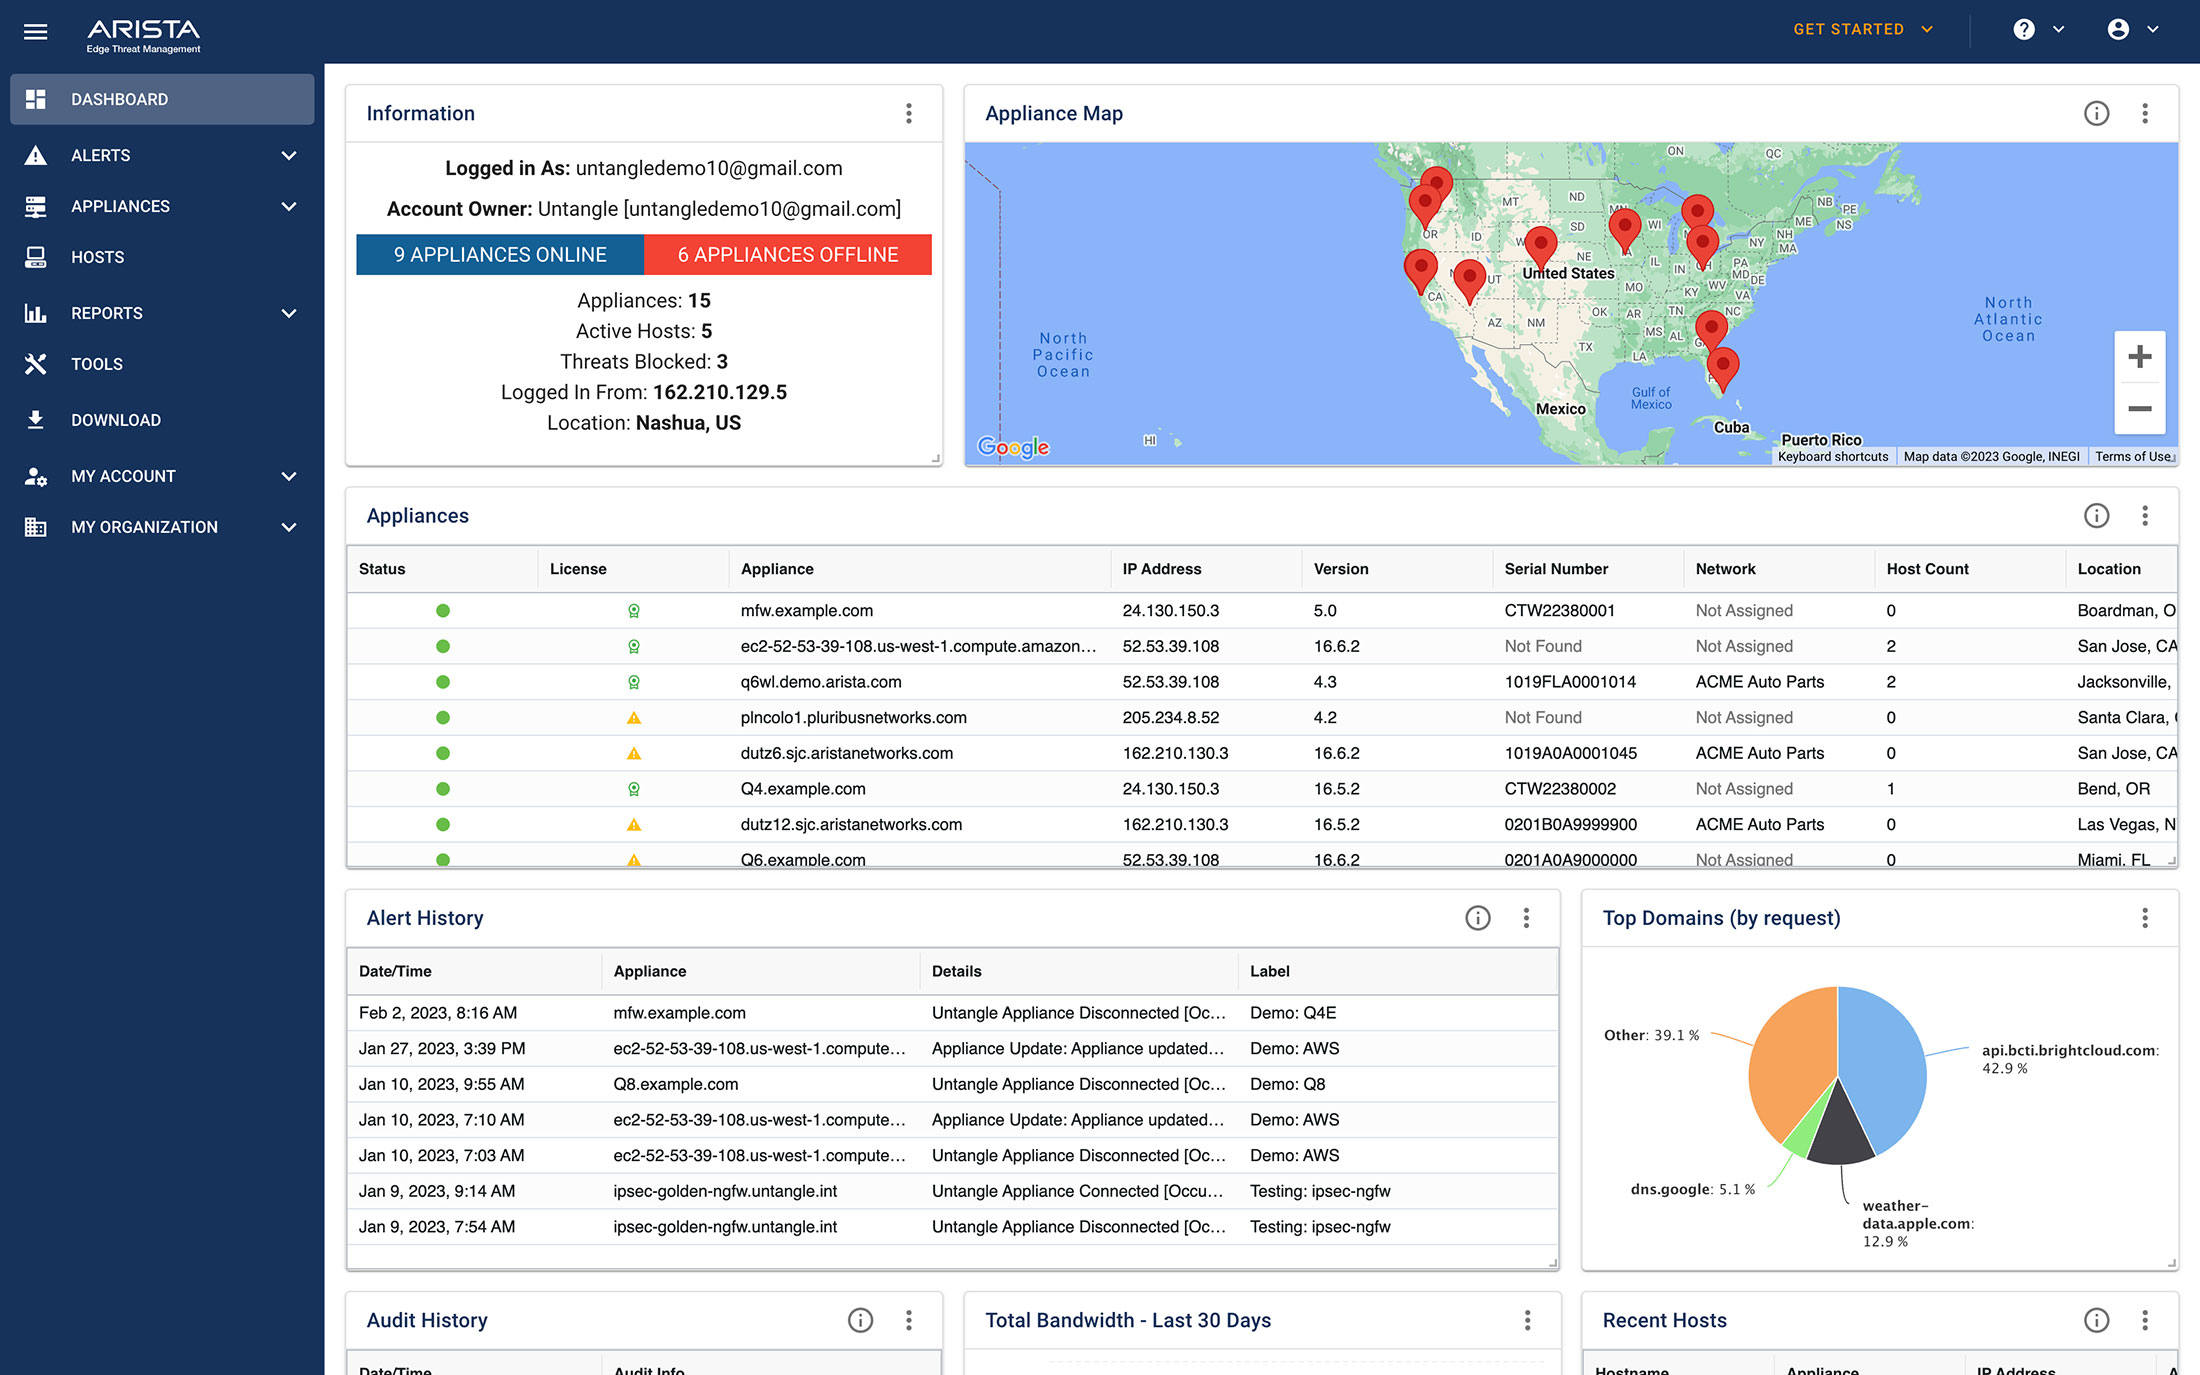
Dashboard
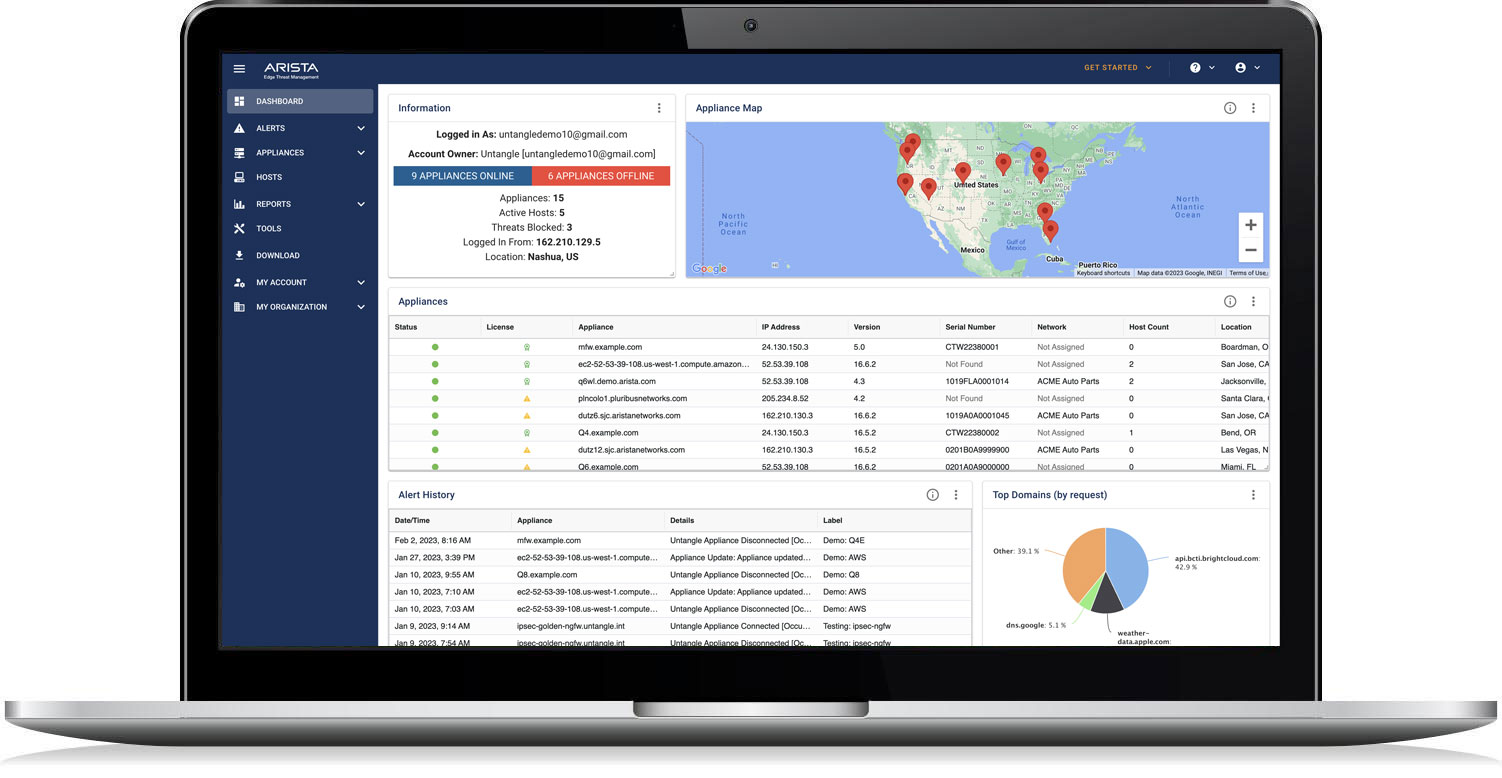
ETM Dashboard’s dashboard gives you an immediate picture of what’s happening on your networks.
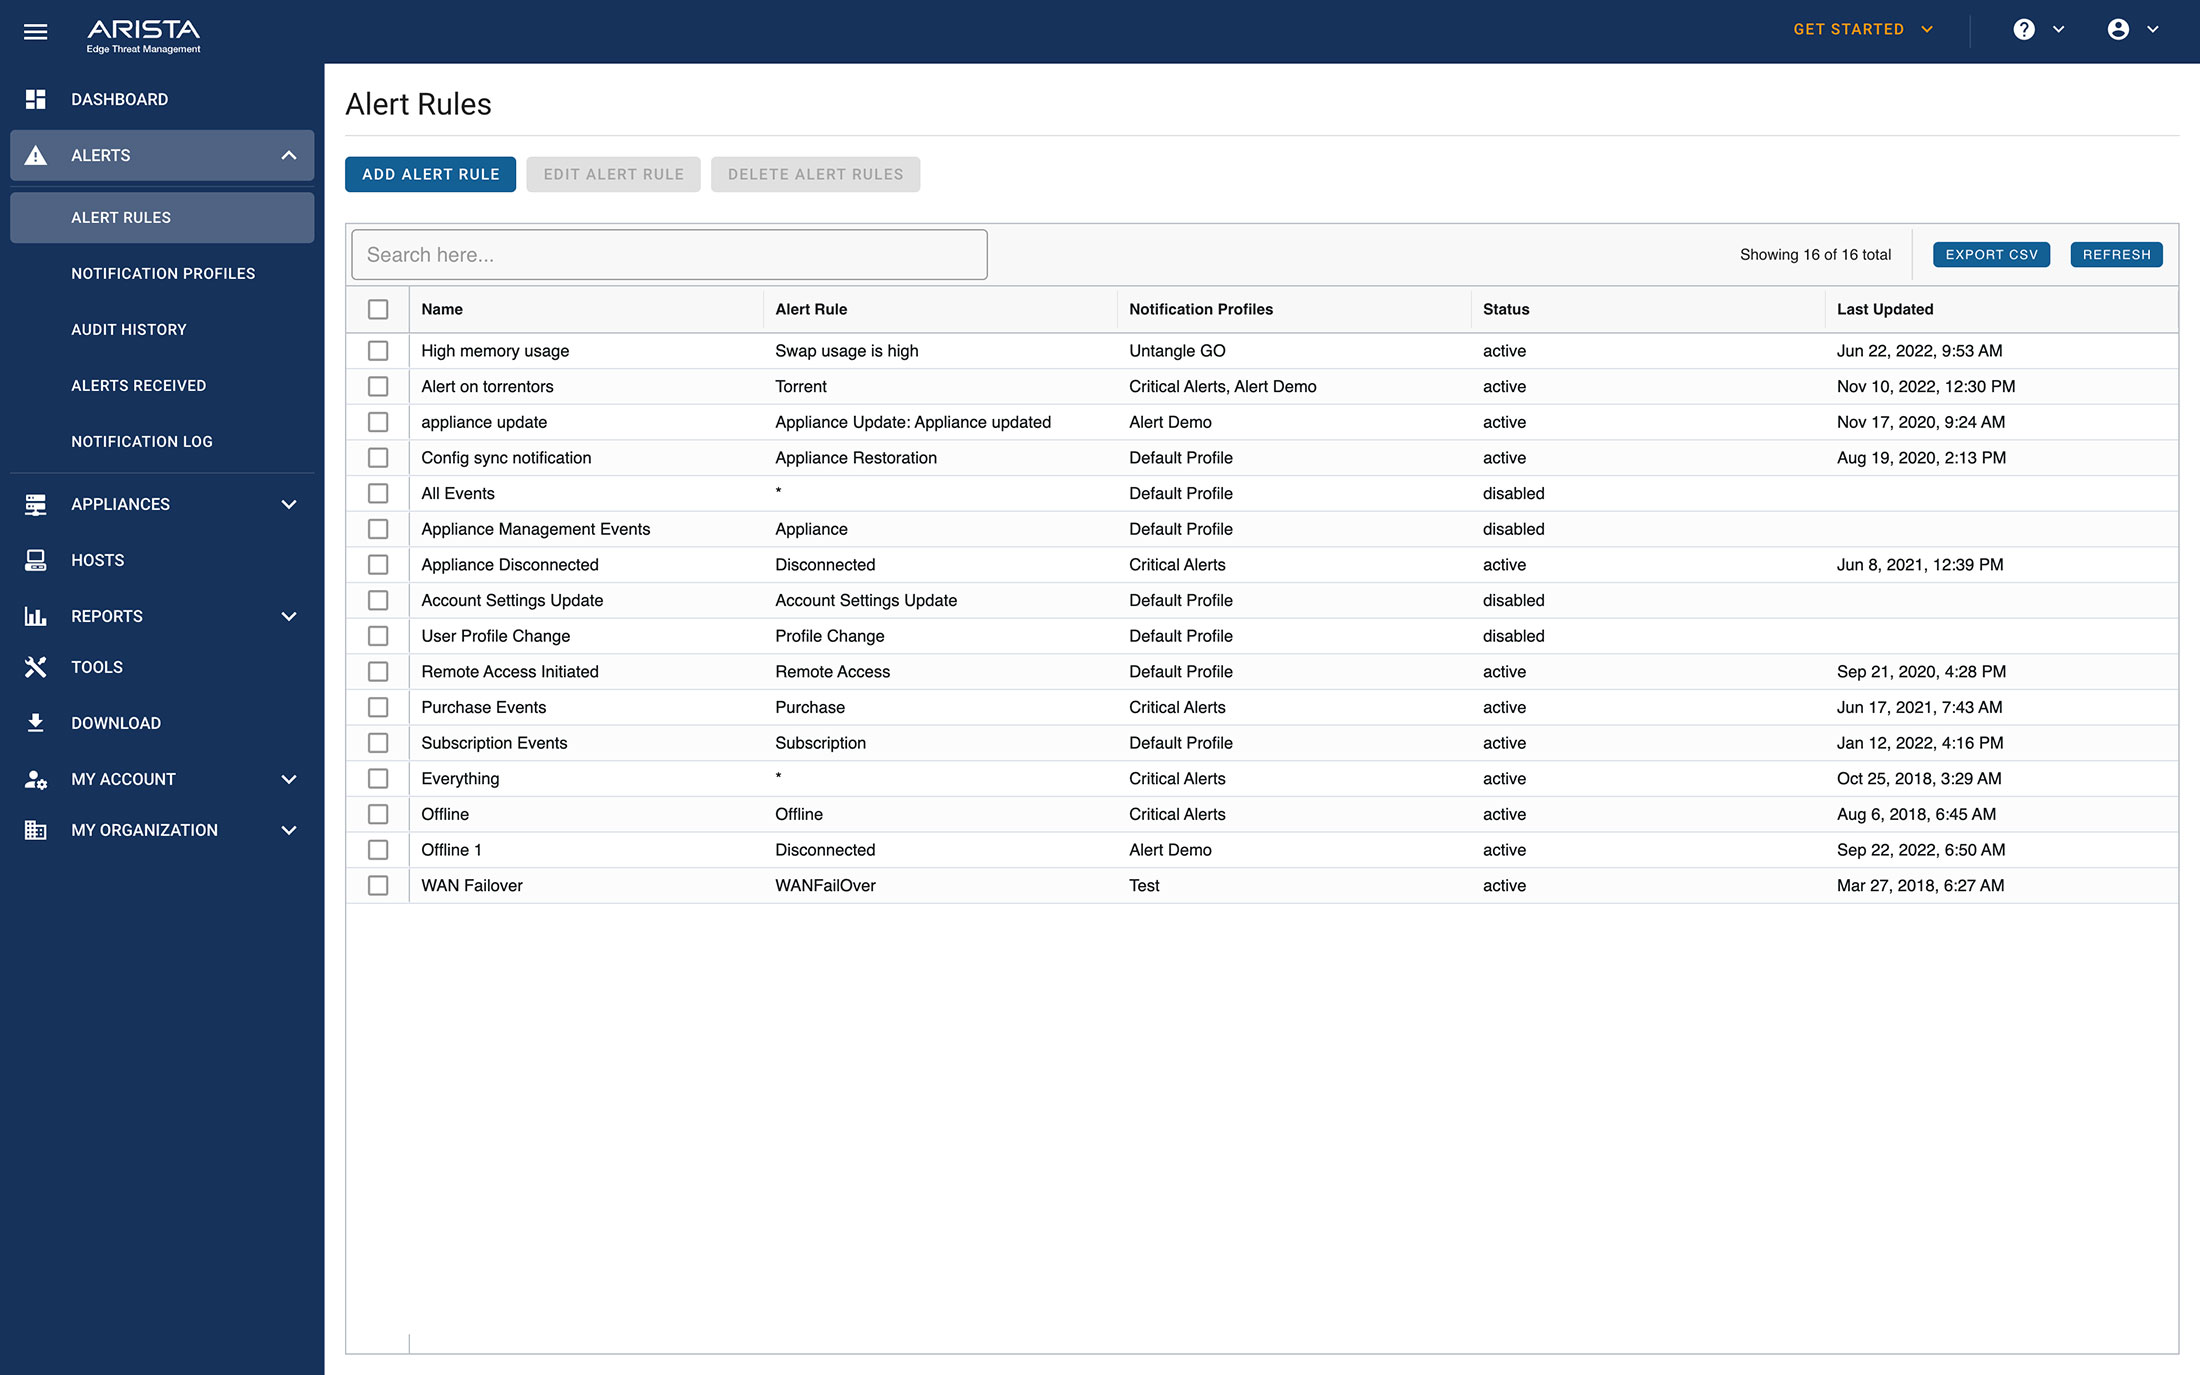
Alerts
Receive global alerts across deployments: improving visibility, ensuring business continuity, and easing management for multi-site deployments and MSPs.
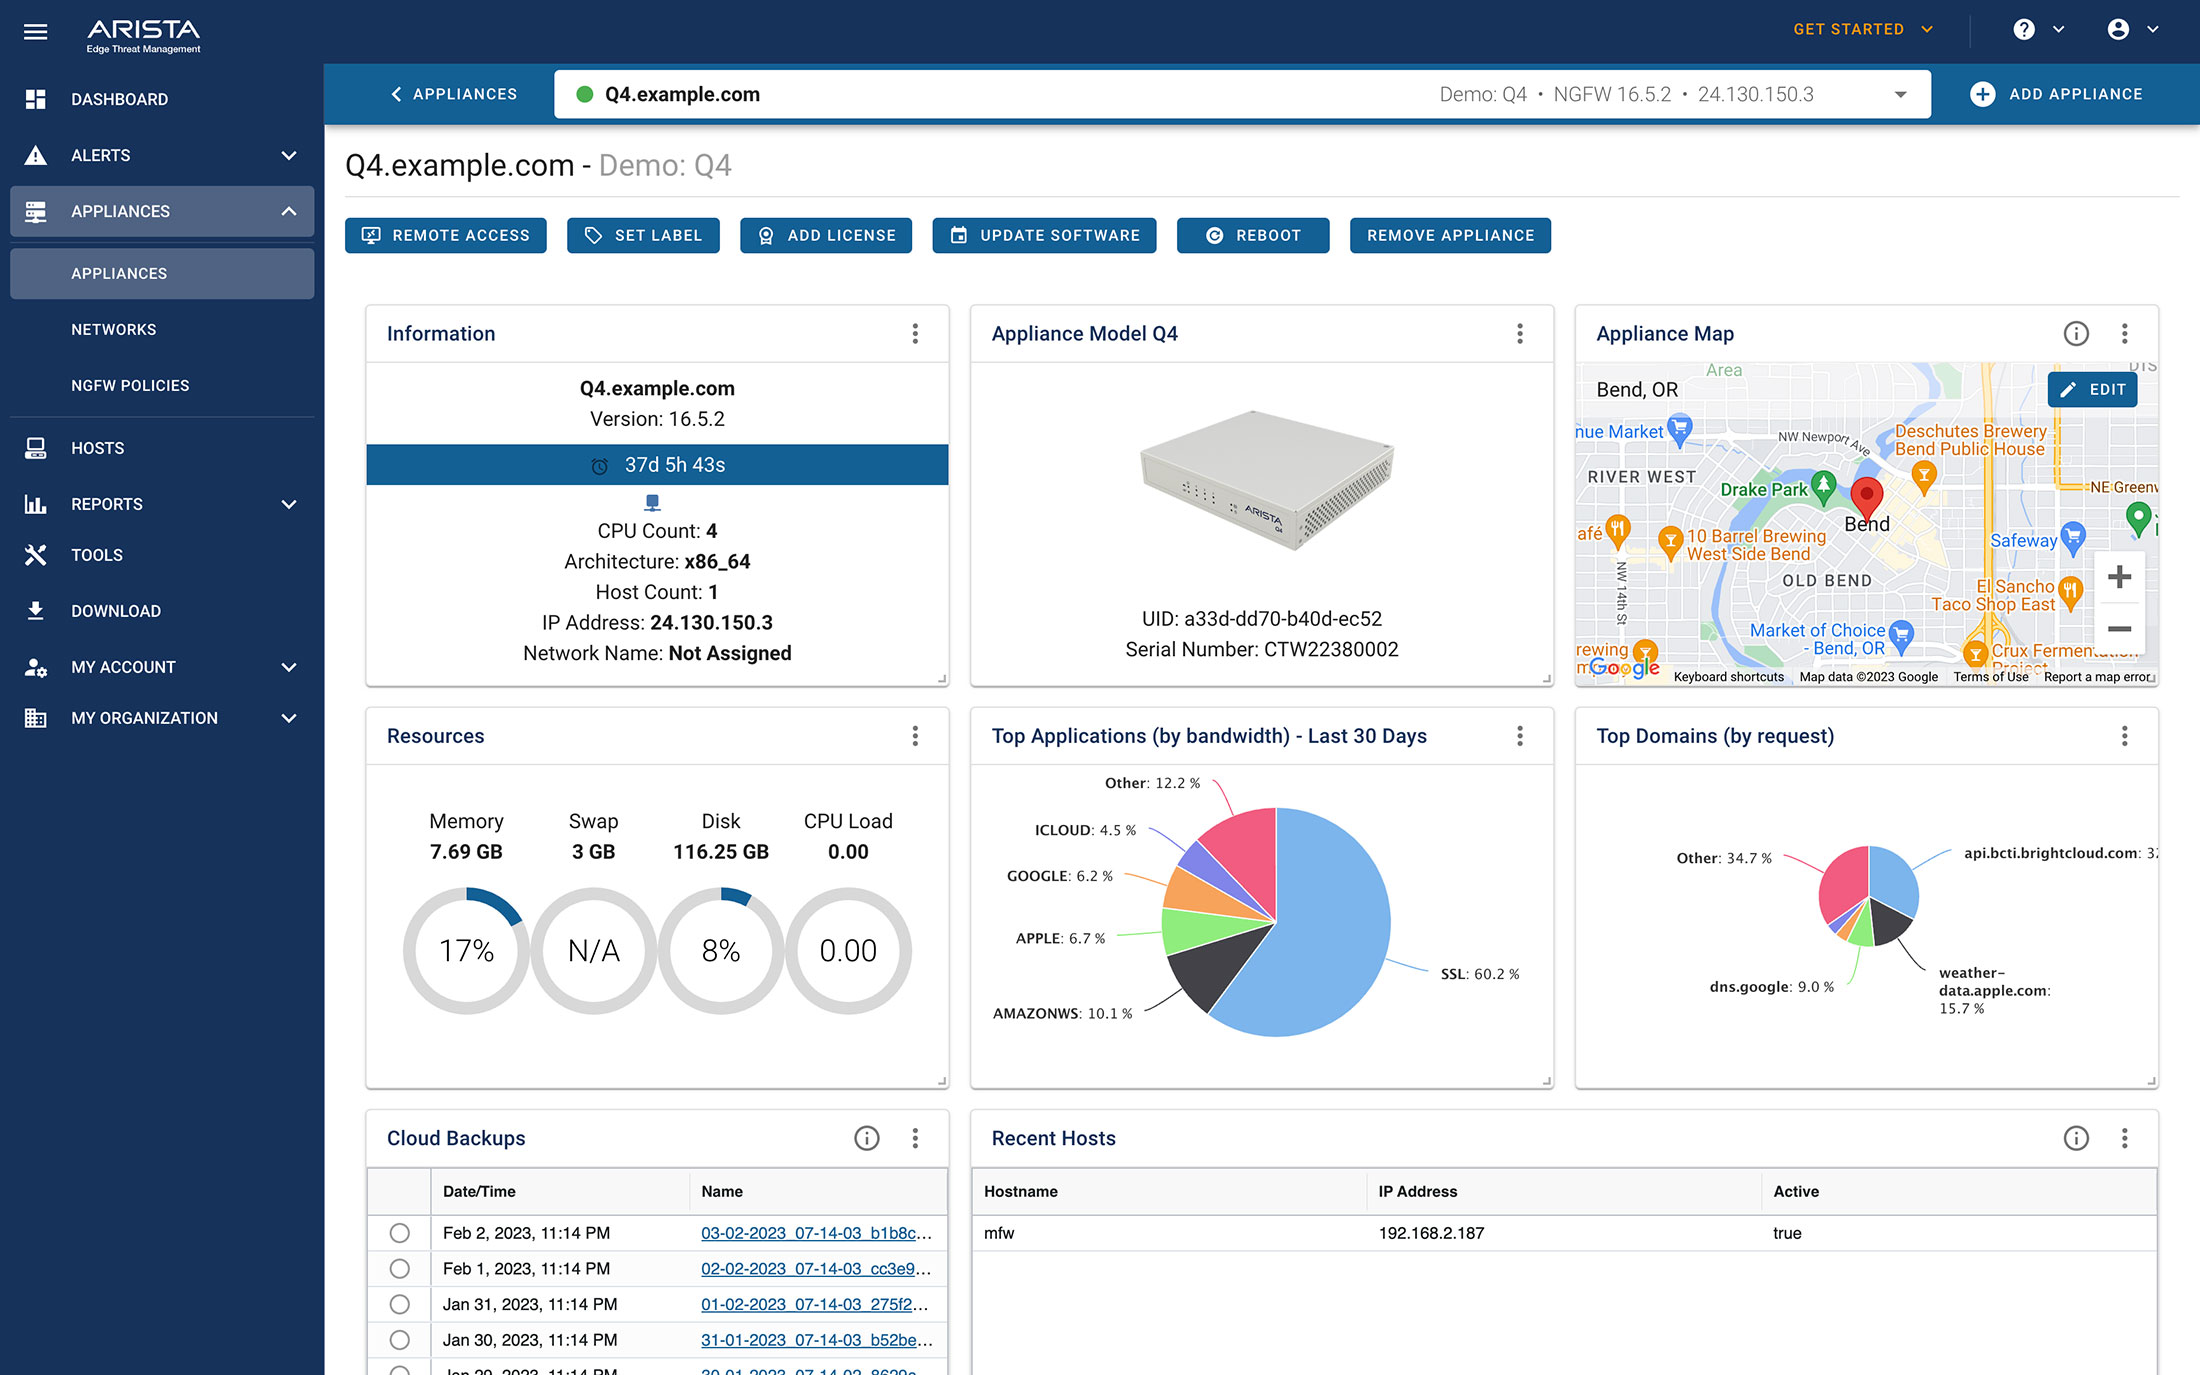
Appliances
See critical information about each NG Firewall and Micro Edge deployment, manage those deployments via remote access, and get alerts and threat history details for each appliance.
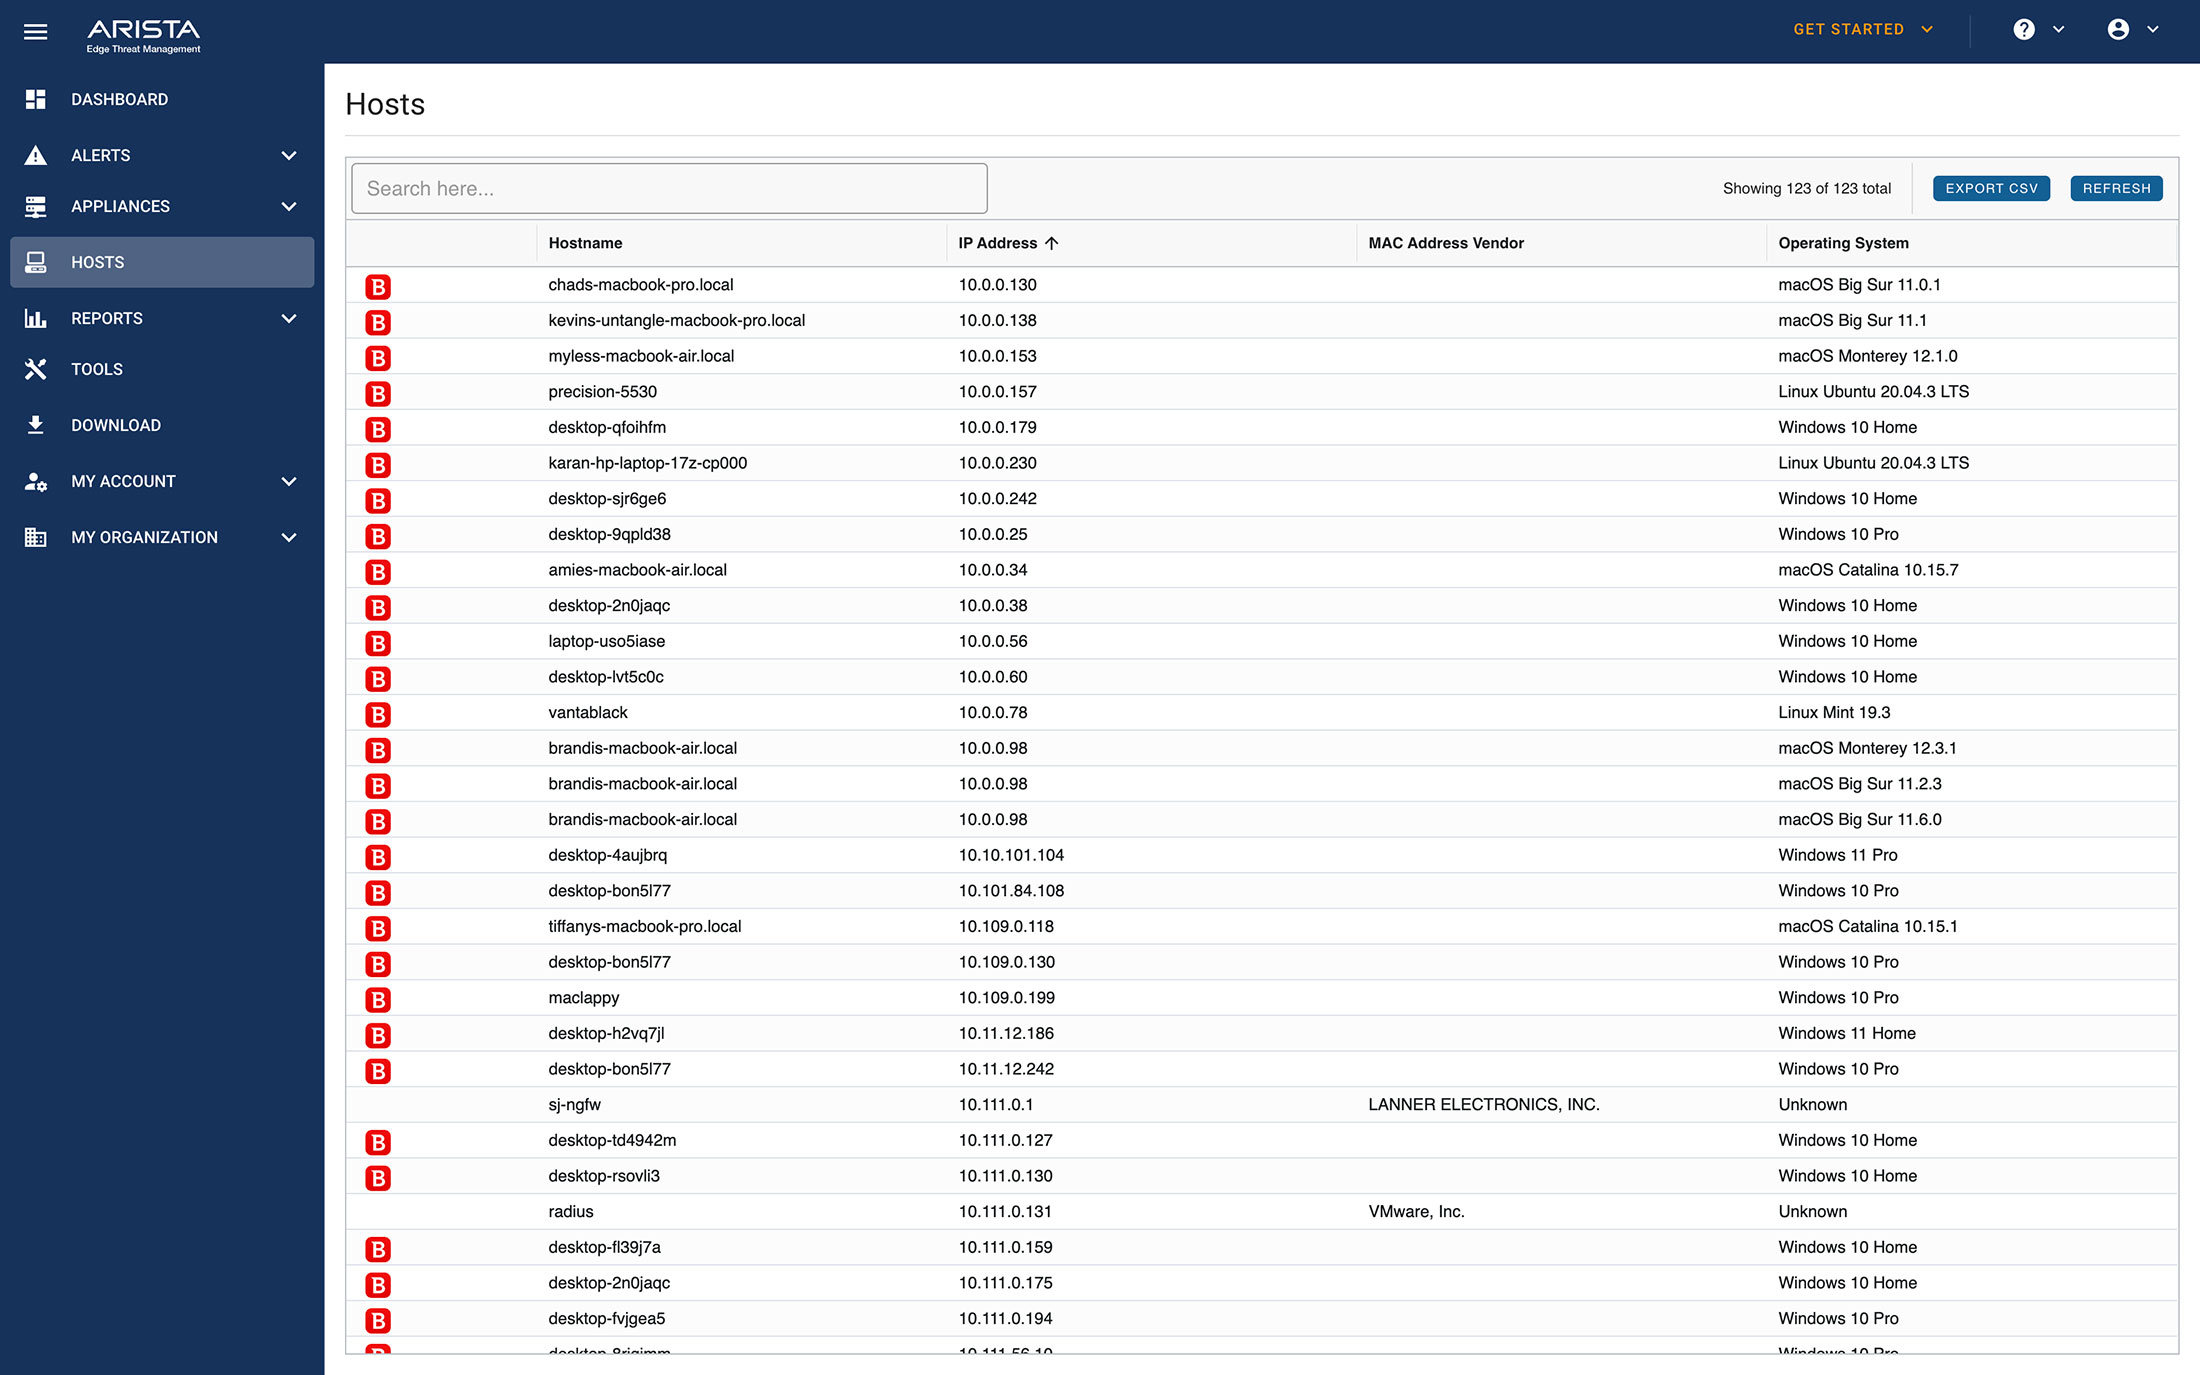
Hosts
View real-time host activities across all deployments. Gain visibility into the security status of each host running Bitdefender, Malwarebytes, or Webroot endpoint protection.
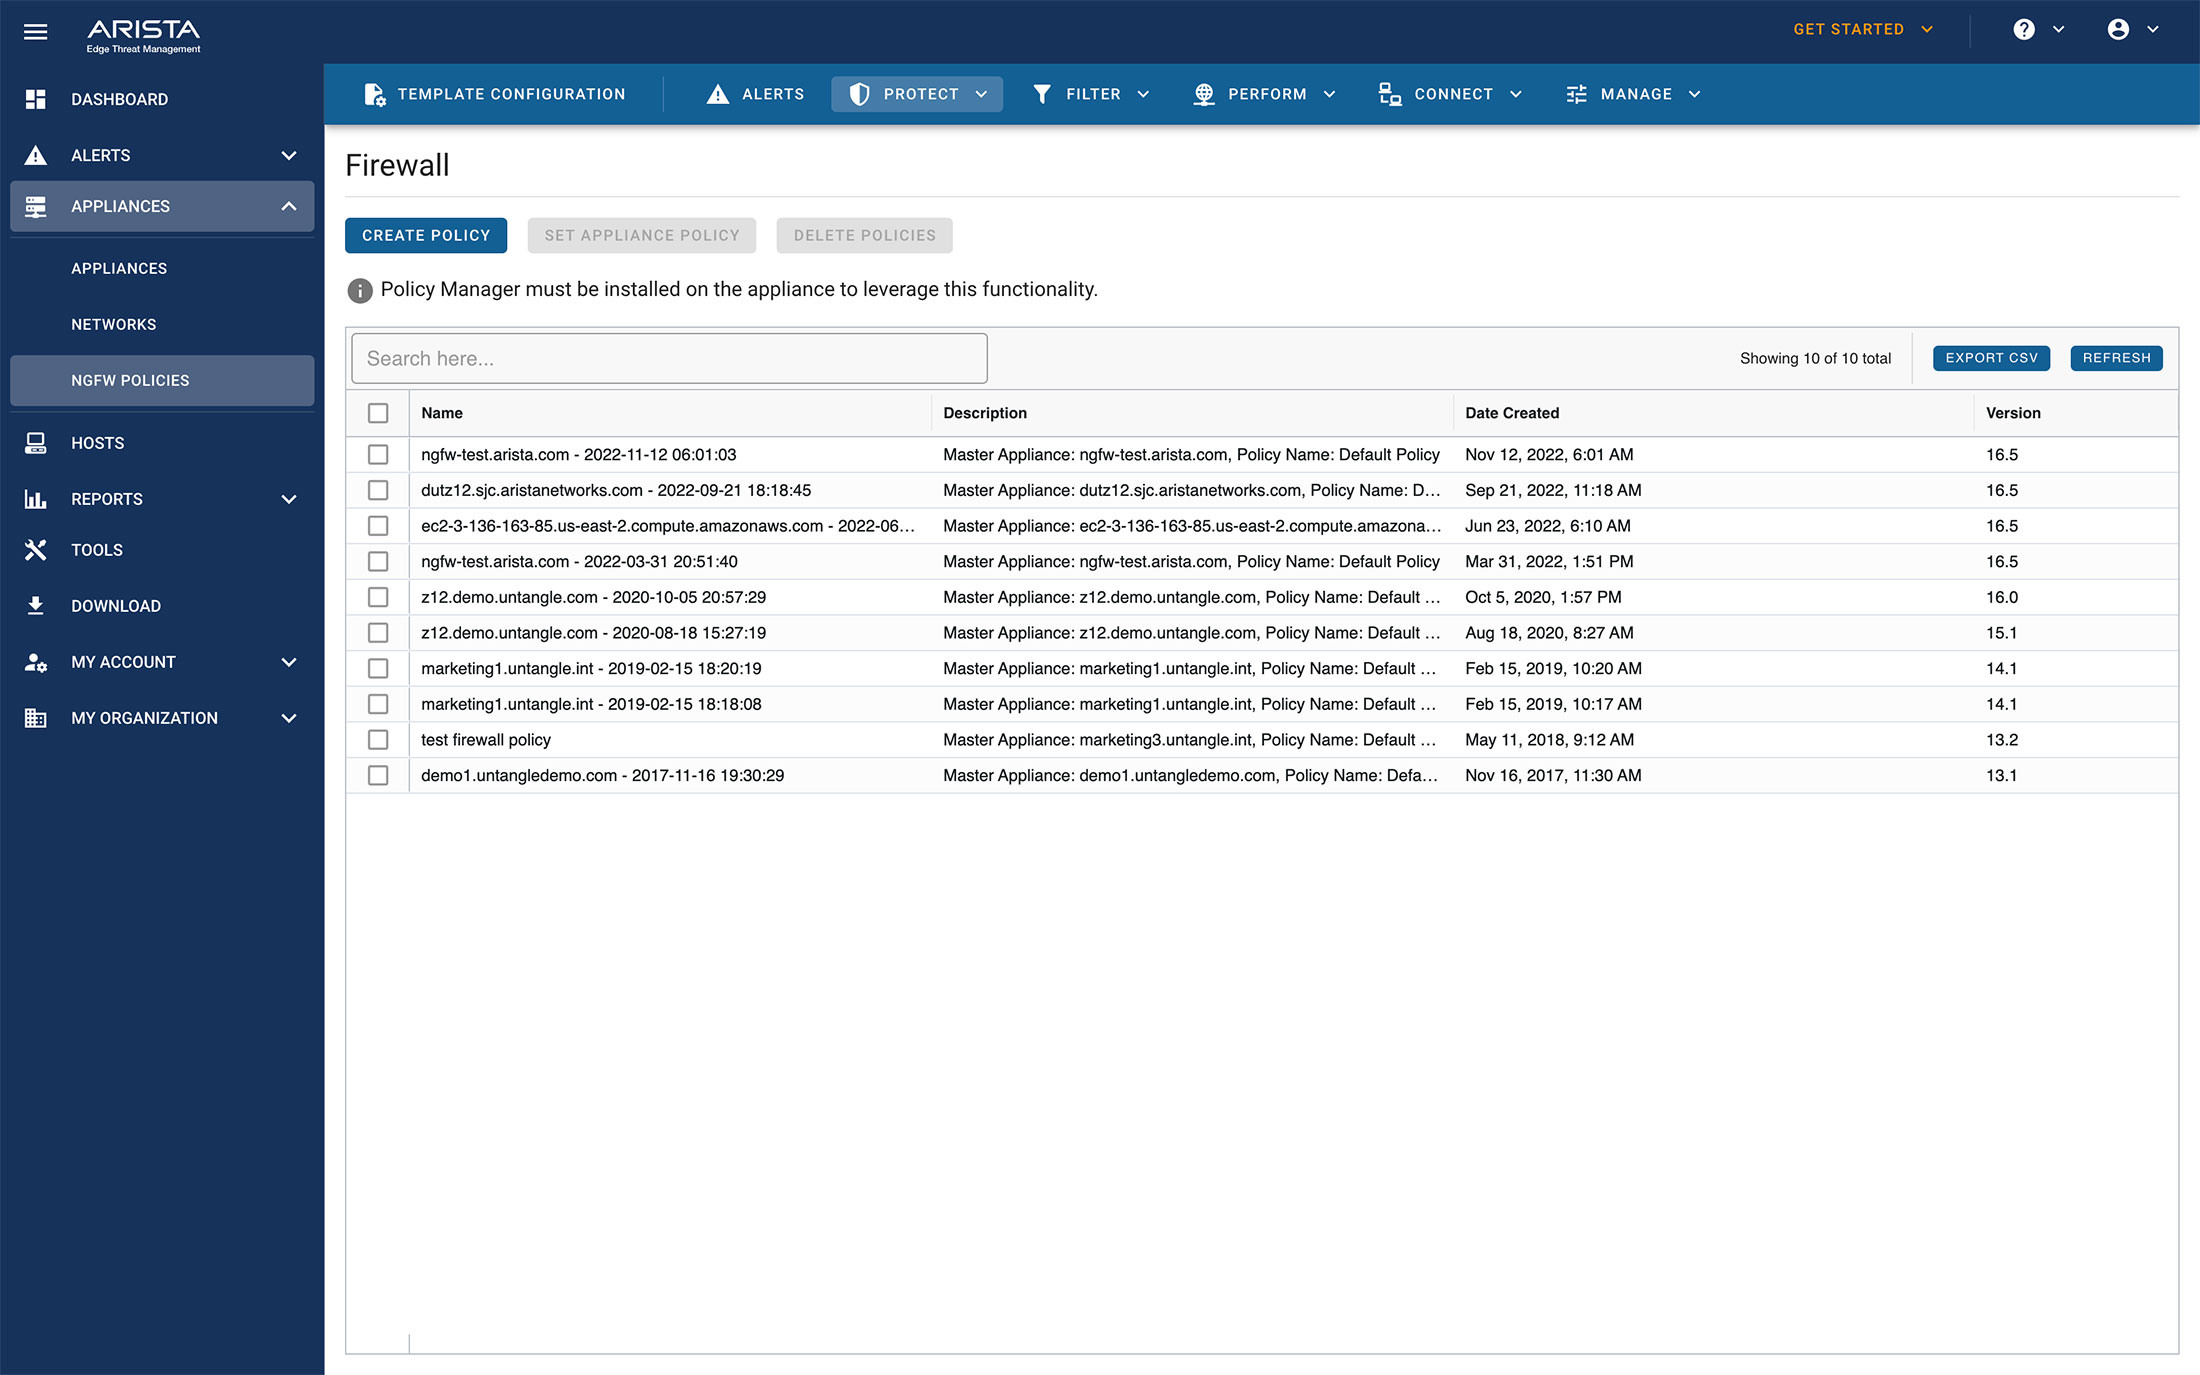
Policies
Easily view, configure, clone and push policies across appliances for a “configure once, deploy anywhere” methodology that reduces management overhead.
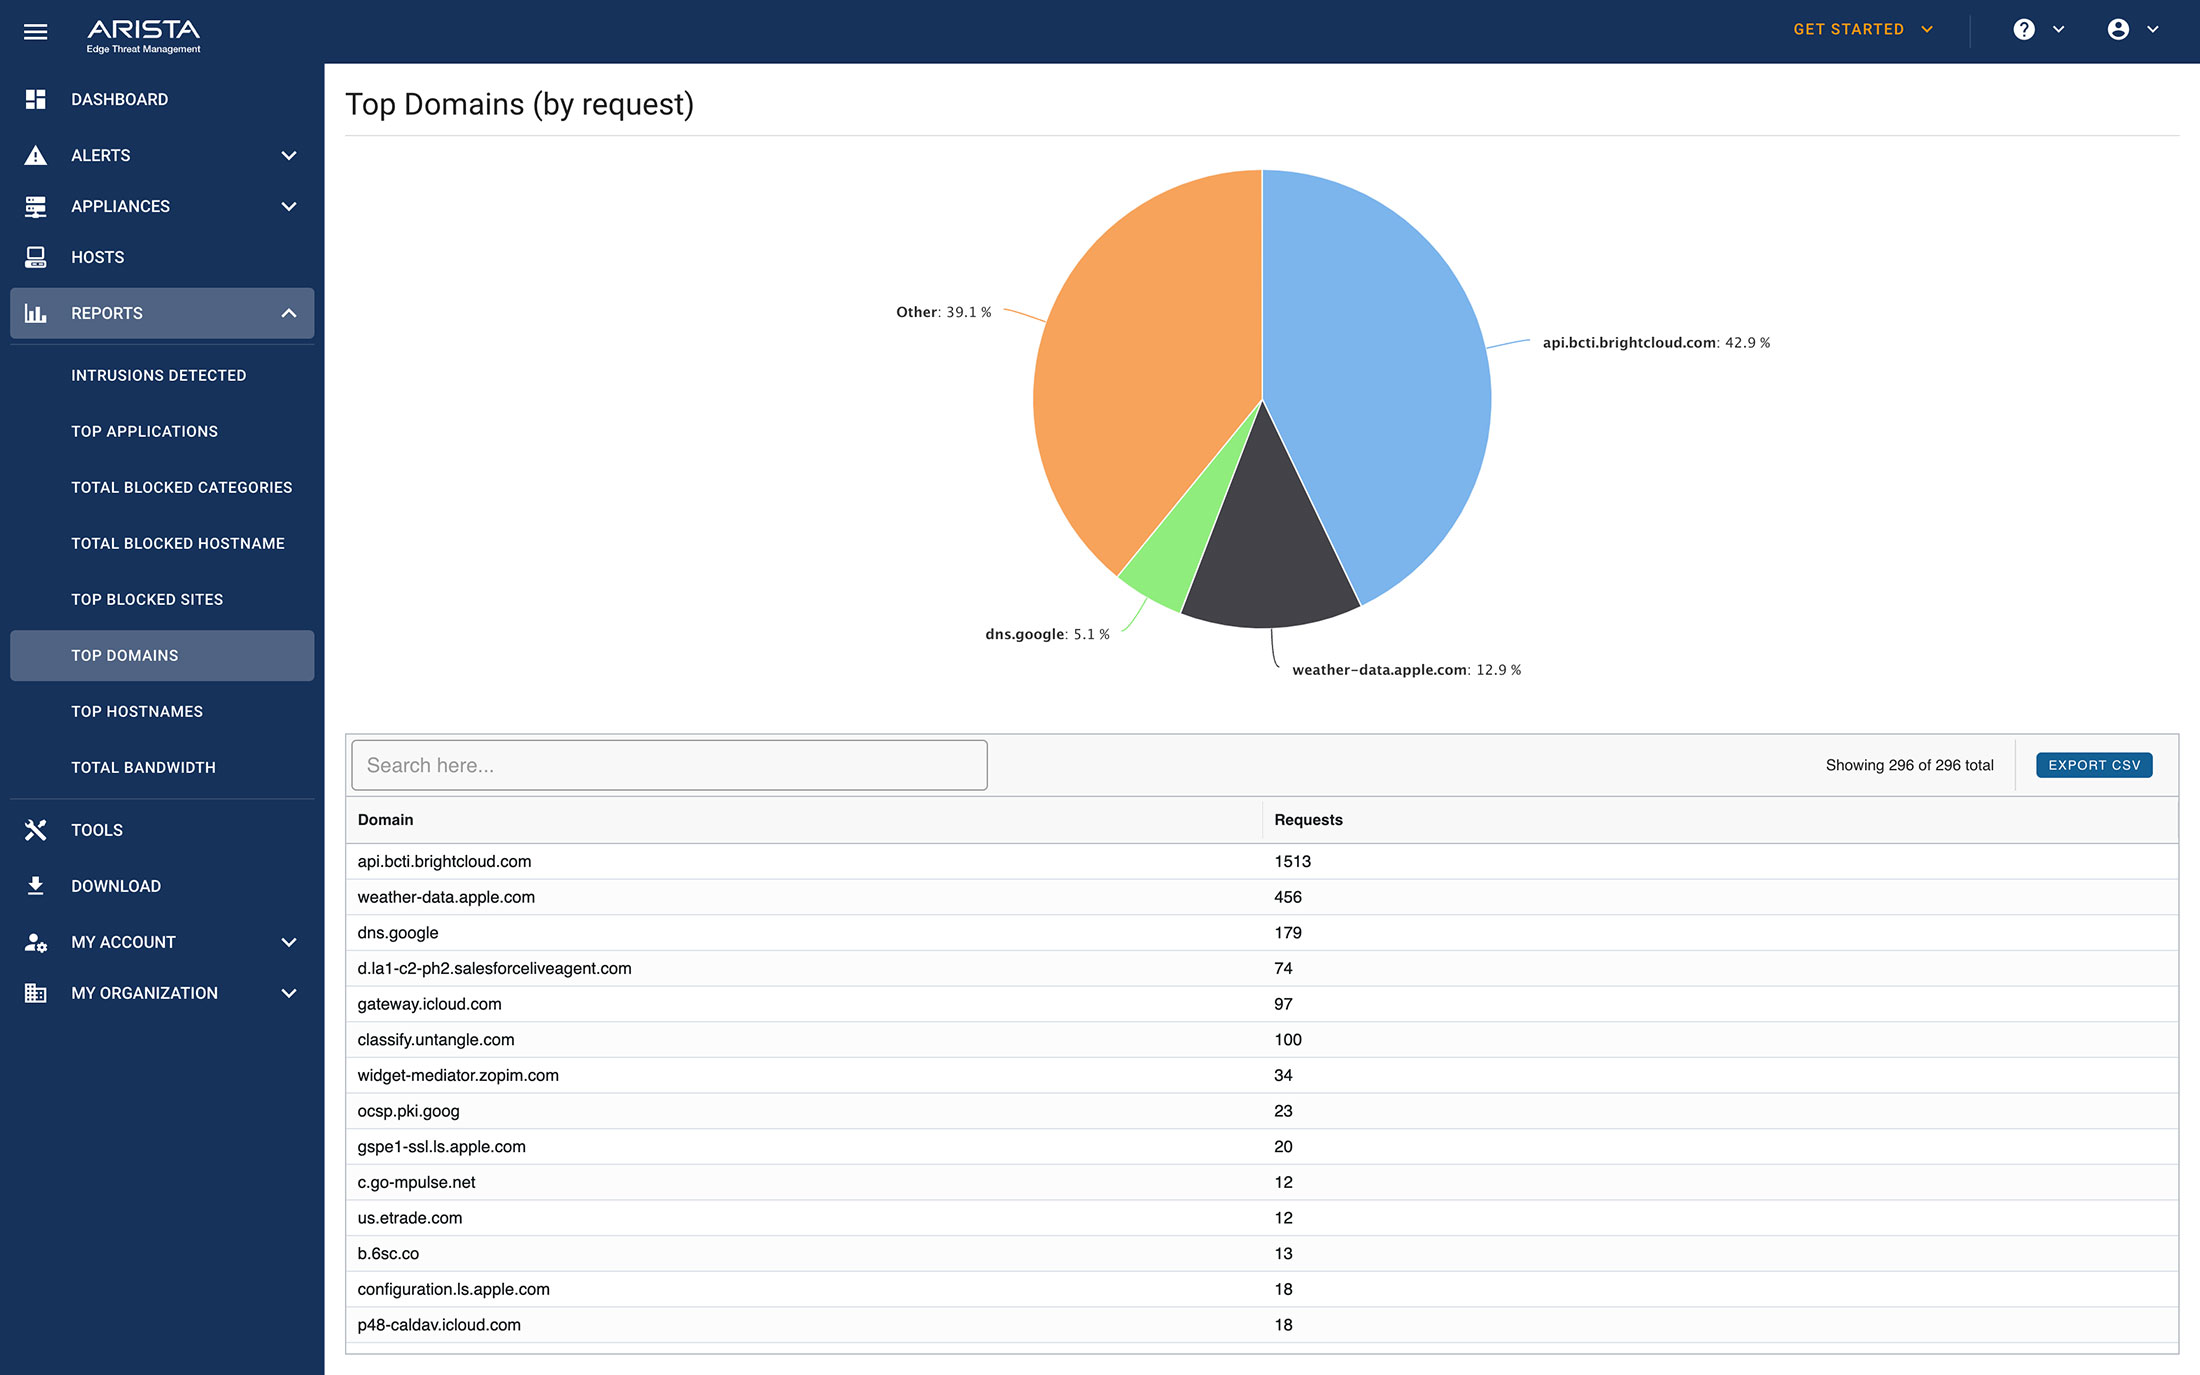
Reports
Access to 30 day aggregated reports for all deployments connected to ETM Dashboard.
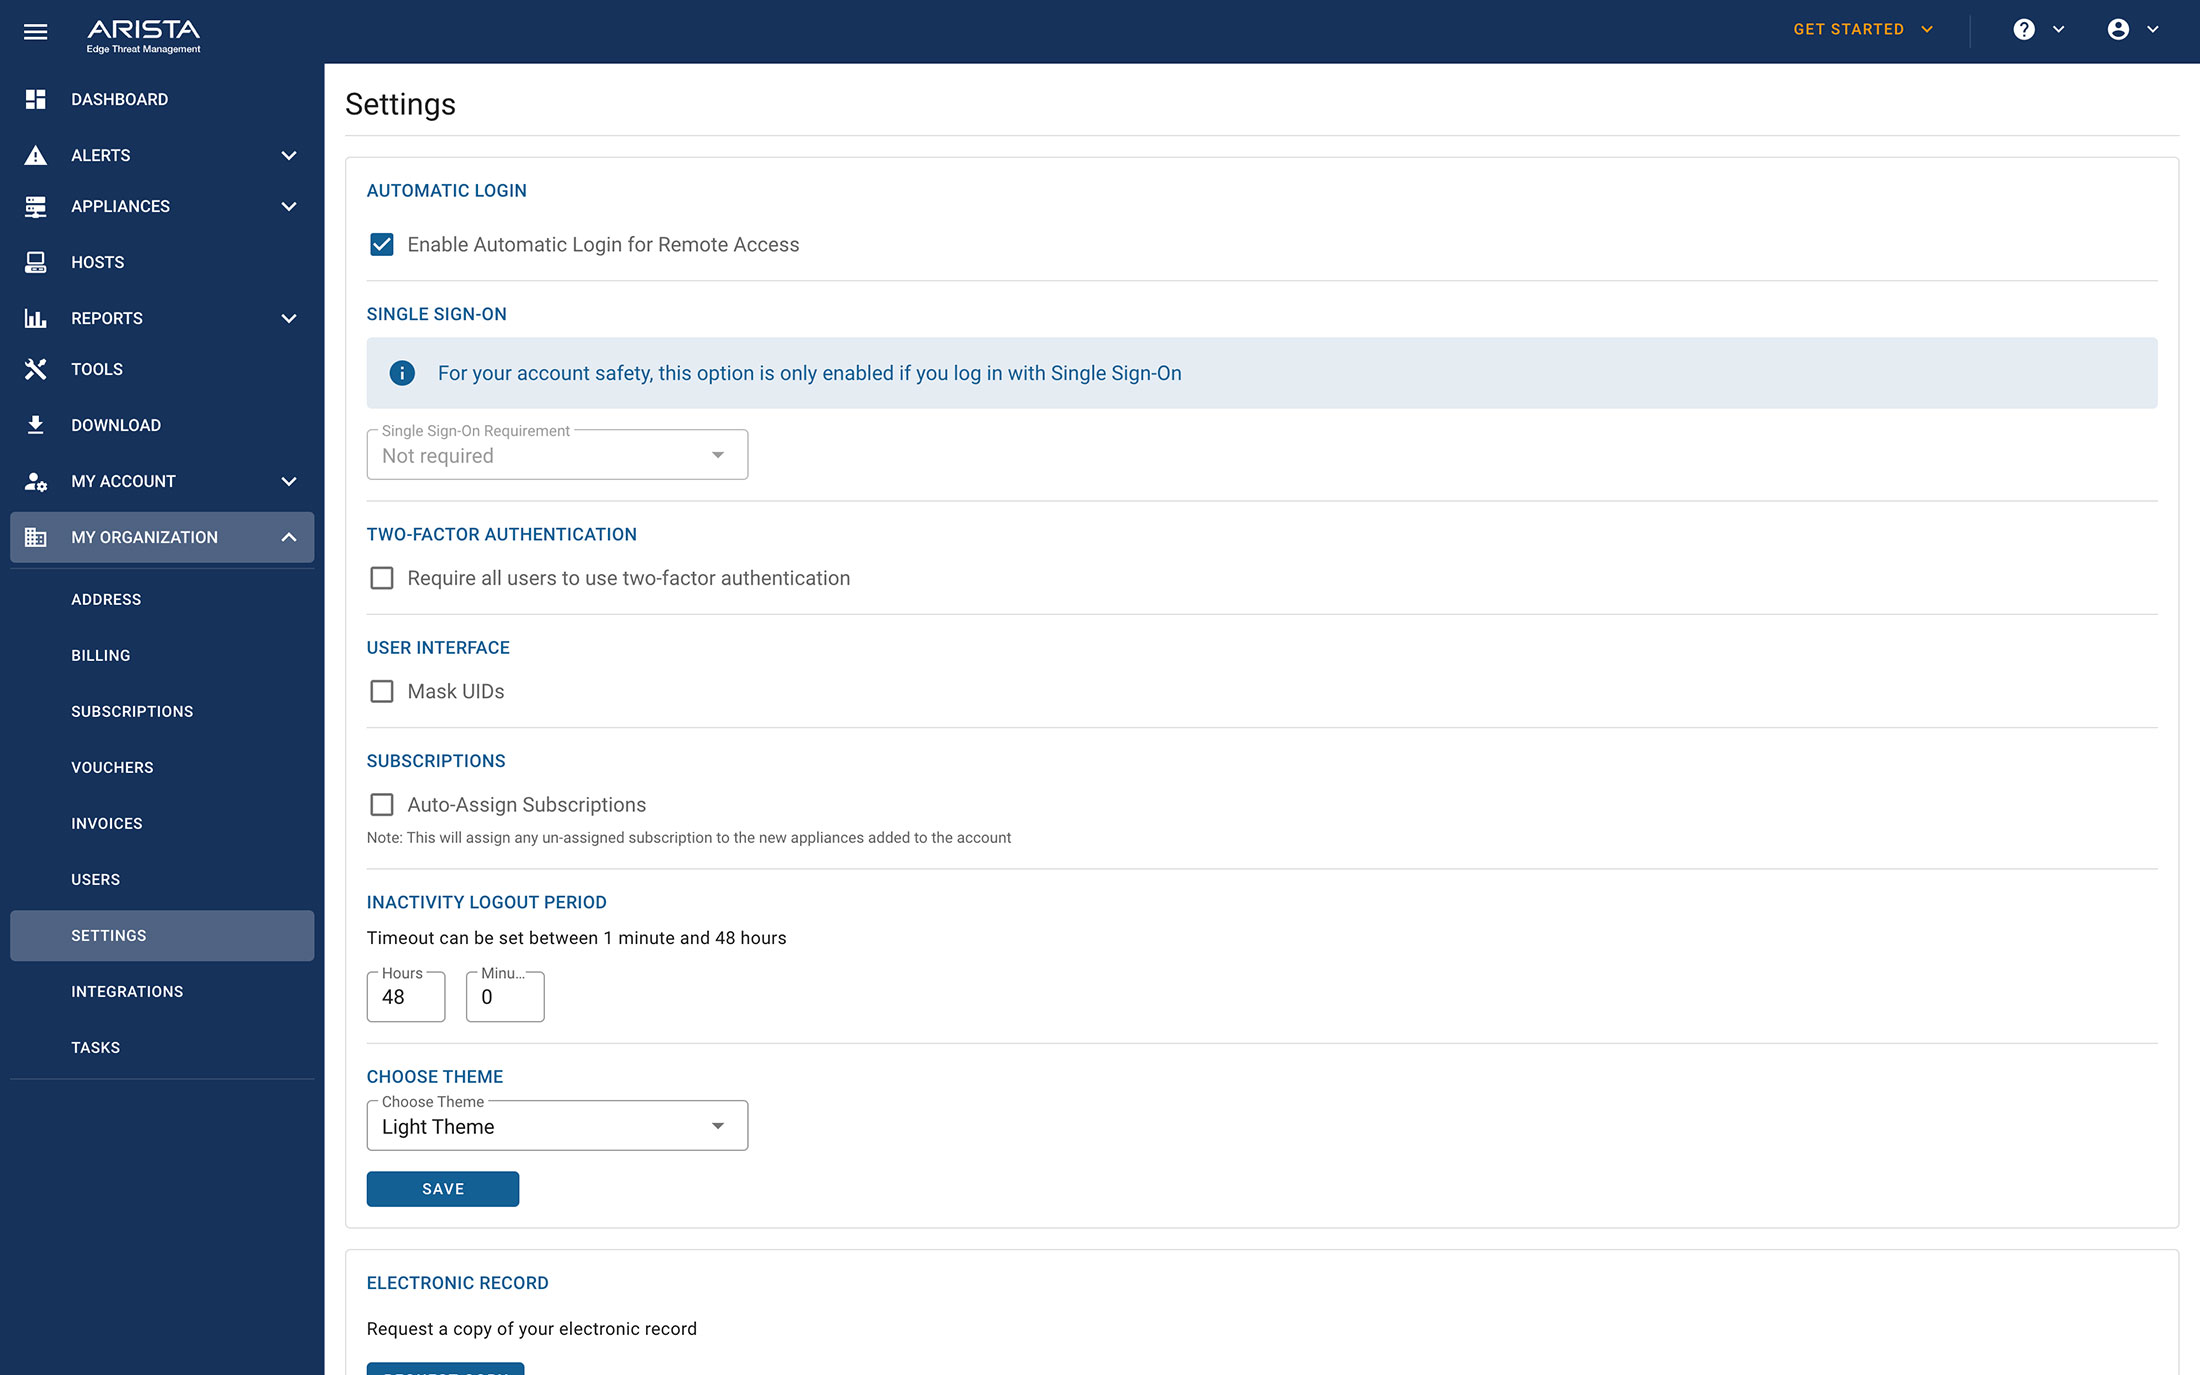
Account
Easily manage all licensing, provisioning and billing information across your account.
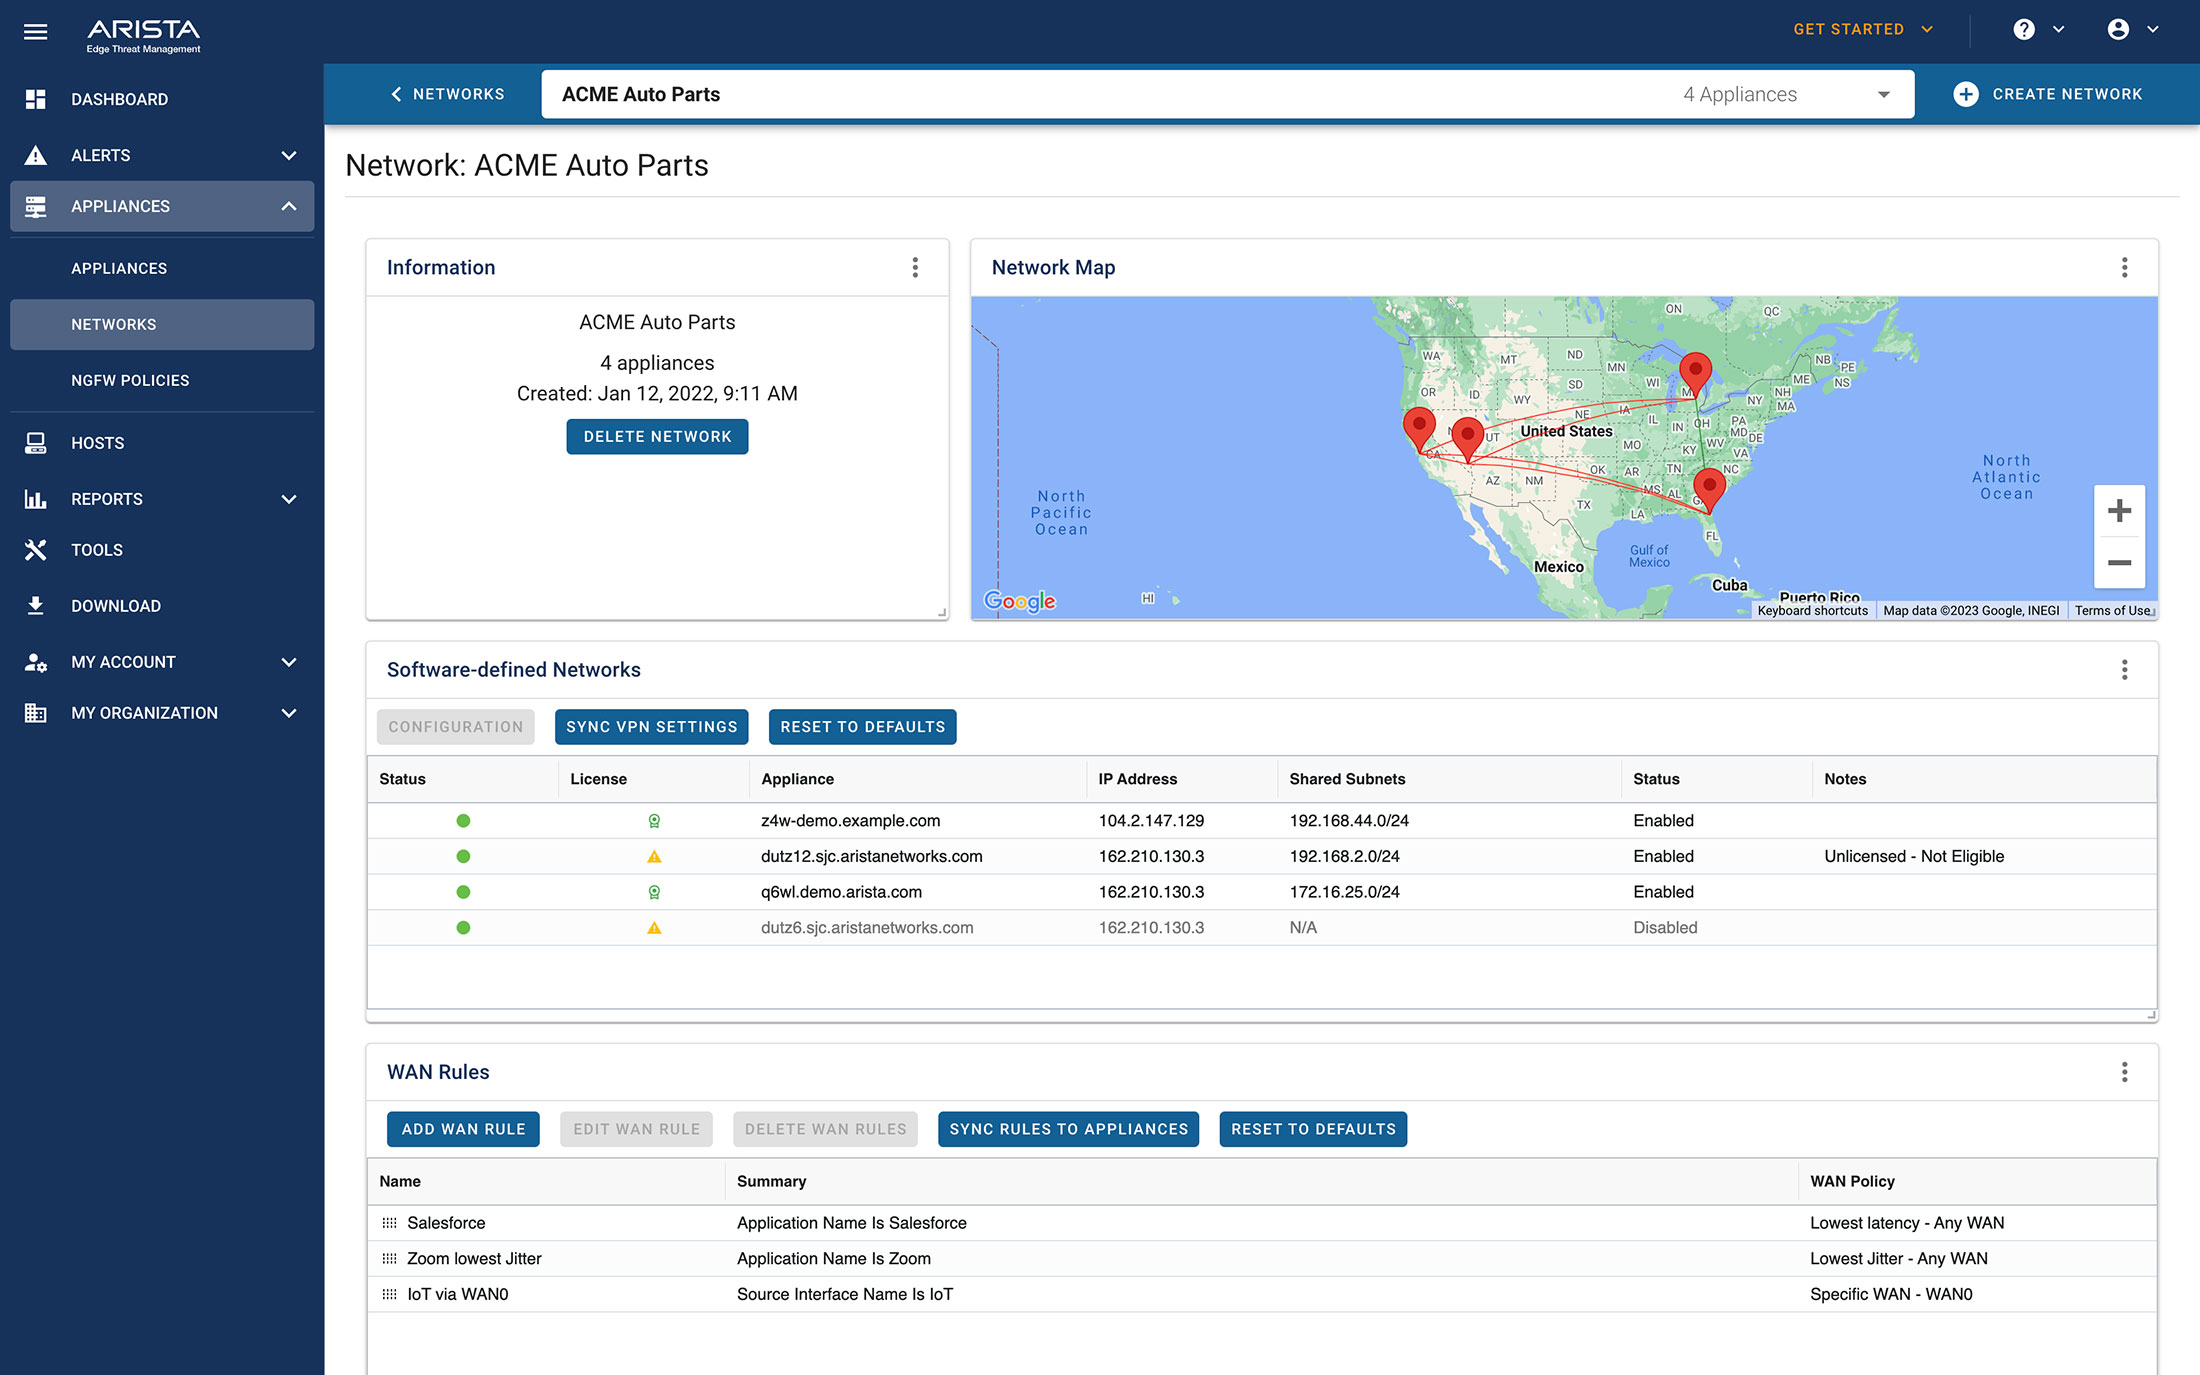
Networks
Group NG Firewall and Micro Edge appliances into a centrally managed network. View aggregated performance data, and create and push shared WAN Rules across all your Micro Edge appliances in that network.
ETM Dashboard at a Glance
These screenshots showcase ETM Dashboard’s interface.
Gives you an immediate picture of what’s happening on your networks. Know the status of each deployment including connectivity, location, top host activity, detected threats, critical alerts, and top bandwidth usage. Maintain compliance with real-time account auditing including changes to account info, purchases, login attempts and more.
Group NG Firewall and Micro Edge appliances to view aggregated performance data, and auto-provision site-to-site VPNs. Create and push shared WAN routing policies across all your Micro Edge appliances in the network.
Create global alerts across deployments to detect events such as an outage or a WAN failure, and be notified if an alert is triggered. Integrate these global alerts with popular management tools like Pager Duty and Slack, and get instant alerts.
Get critical information including system status and uptime information, number of active hosts, resource and bandwidth usage, configuration backups, top network activity, along with network, software and hardware information, alerts and threat information and more. Remotely manage each deployment via a secure remote connection, create or restore backups and perform software updates.
View the real-time activities of all hosts across all of your managed deployments, including operating system, active sessions, summary details, and more. Integrations with Bitdefender, Malwarebytes, and Webroot endpoint protection provide detailed security status of each host, including last scan results and threat history. Easily perform an antivirus scan or receive alerts when a threat is detected.
Configure policies across NG Firewall deployments in Policies. View policies by appliance, then clone and push those policies to any other appliance. This “configure once, deploy anywhere” capability radically reduces management overhead.
Provides 30-day aggregated reporting for all your NG Firewall deployments within ETM Dashboard. Reports include: Audit History, Bandwidth Control: Top Applications (by bandwidth), Events: Alerts Received, Events: Notification Log, Top Hostnames (by bandwidth), Total Bandwidth, Web Filter: Top Domains (by request).
Easily manage licensing, provisioning and billing. Divide responsibilities across user roles by creating administrative accounts and associated privileges across multiple deployments.
Gives you an immediate picture of what’s happening on your networks. Know the status of each deployment including connectivity, location, top host activity, detected threats, critical alerts, and top bandwidth usage. Maintain compliance with real-time account auditing including changes to account info, purchases, login attempts and more.
Group Untangle NG Firewall and Micro Edge appliances to view aggregated performance data. Create and push shared WAN routing policies across all your Micro Edge appliances in that network.
Create global alerts across deployments to detect events such as an outage or a WAN failure, and be notified if an alert is triggered. Integrate these global alerts with popular management tools like Pager Duty and Slack, and get instant alerts.
Get critical information including system status and uptime information, number of active hosts, resource and bandwidth usage, configuration backups, top network activity, along with network, software and hardware information, alerts and threat information and more. Remotely manage each deployment via a secure remote connection, create or restore backups and perform software updates.
View the real-time activities of all hosts across all of your managed deployments, including operating system, active sessions, summary details, and more. Integrations with Bitdefender, Malwarebytes, and Webroot endpoint protection provide detailed security status of each host, including, last scan results and threat history. Easily perform an antivirus scan or receive alerts when a threat is detected.
Configure policies across NG Firewall deployments in Policies. View policies by appliance, then clone and push those policies to any other appliance. This “configure once, deploy anywhere” capability radically reduces management overhead.
Provides 30-day aggregated reporting for all your NG Firewall deployments within ETM Dashboard. Reports include: Audit History, Bandwidth Control: Top Applications (by bandwidth), Events: Alerts Received, Events: Notification Log, Top Hostnames (by bandwidth), Total Bandwidth, Web Filter: Top Domains (by request).
Easily manage licensing, provisioning and billing. Divide responsibilities across user roles by creating administrative accounts and associated privileges across multiple deployments.

